Fig. 2
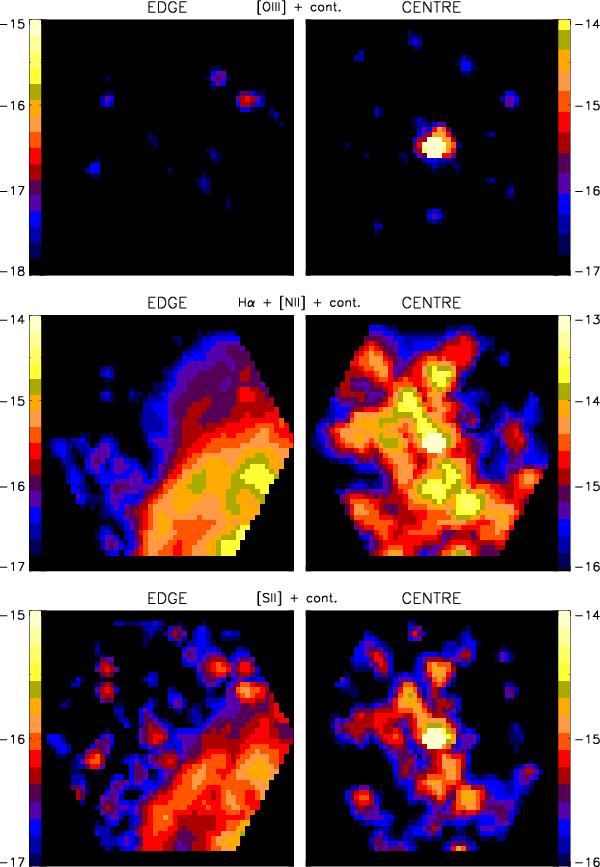
Interpolated images of M1-67 of the two observed regions: in the left column the edge pointing and in the right the central one. In each row we represent the flux (including continuum) integrated in a wavelength range. Top: range 5006 Å−5014 Å including [Oiii]λ5007 Å. Middle: range 6562 Å−6590 Å including Hα and [Nii]λ6584 Å. Bottom: range 6729 Å−6737 Å including [Sii]λλ6717, 6731 Å. All the maps are represented on logarithmic scales with units of log (erg cm-2 s-1). The size of the hexagon side is 38′′. In all the maps, north is up and east to the left (see Fig. 1).
Current usage metrics show cumulative count of Article Views (full-text article views including HTML views, PDF and ePub downloads, according to the available data) and Abstracts Views on Vision4Press platform.
Data correspond to usage on the plateform after 2015. The current usage metrics is available 48-96 hours after online publication and is updated daily on week days.
Initial download of the metrics may take a while.