Free Access
Fig. 12
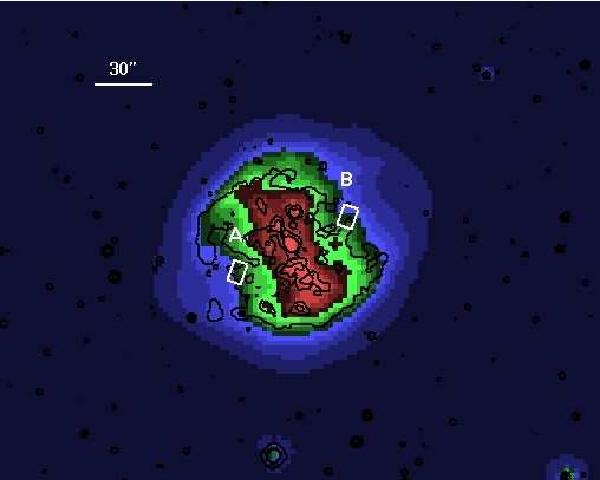
MIPS 24 μm image of M1-67. North is up and east left. Boxes indicate the two regions where IR spectra were obtained. Contourns represent the Hα emission derived from Fig. 1.
Current usage metrics show cumulative count of Article Views (full-text article views including HTML views, PDF and ePub downloads, according to the available data) and Abstracts Views on Vision4Press platform.
Data correspond to usage on the plateform after 2015. The current usage metrics is available 48-96 hours after online publication and is updated daily on week days.
Initial download of the metrics may take a while.