Fig. 11
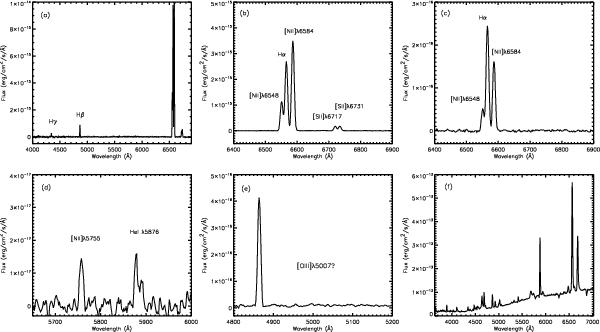
Examples of integrated spectra. From left to right and top to bottom: a) Whole spectrum of Region 3. b) Spectrum of Region 5 in the range of Hα. c) Region 7, in same range as b, where the absence of sulphur lines can be seen. d) Spectrum of Region 5 centred on the [Nii]λ5755 Å emission line, used to calculate the electron temperature. e) Zoom over the spectrum in Region S2 without any emission in the [Oiii]λ5007 Å emission line. f) Whole spectrum of WR124 obtained from the central spaxel.
Current usage metrics show cumulative count of Article Views (full-text article views including HTML views, PDF and ePub downloads, according to the available data) and Abstracts Views on Vision4Press platform.
Data correspond to usage on the plateform after 2015. The current usage metrics is available 48-96 hours after online publication and is updated daily on week days.
Initial download of the metrics may take a while.