Free Access
Fig. 10
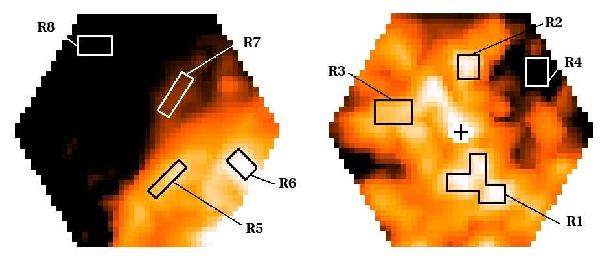
Hα images of the two areas of M1-67 observed with PPAK. Boxes represent the eight regions where the integrated spectra were generated. For the offsets of each region from the central star (green cross), see the text. Orientations and sizes are as in Fig. 2. Edge on the left and centre on the right.
Current usage metrics show cumulative count of Article Views (full-text article views including HTML views, PDF and ePub downloads, according to the available data) and Abstracts Views on Vision4Press platform.
Data correspond to usage on the plateform after 2015. The current usage metrics is available 48-96 hours after online publication and is updated daily on week days.
Initial download of the metrics may take a while.