Fig. 4
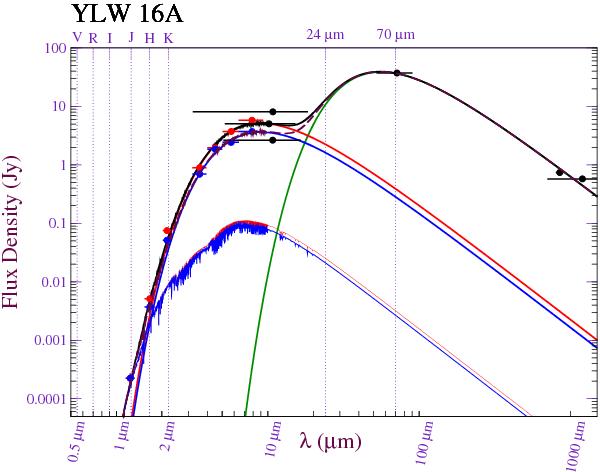
The model SED fit to observed YLW 16A photometry. Red circles correspond to JHK and Spitzer IRAC photometry during the bright state; blue circles correspond to the faint state. The summed model SED fit (black curve: bright state; maroon dashed curve: faint state) has contributions from a composite star (lower synthetic SEDs peaking at ~0.1 Jy; red: bright state; blue: faint state), hot dust (upper left blackbody curves peaking at a few Jy, red: bright state; blue: faint state), and cold dust (green blackbody curve). Ground-based historical 10.8 μm photometry, Spitzer MIPS 70 micron photometry and sub-mm photometry is shown as black circles (YLW 16A is saturated at 24 μm in the Spitzer c2d survey data).
Current usage metrics show cumulative count of Article Views (full-text article views including HTML views, PDF and ePub downloads, according to the available data) and Abstracts Views on Vision4Press platform.
Data correspond to usage on the plateform after 2015. The current usage metrics is available 48-96 hours after online publication and is updated daily on week days.
Initial download of the metrics may take a while.