Free Access
Fig. 3
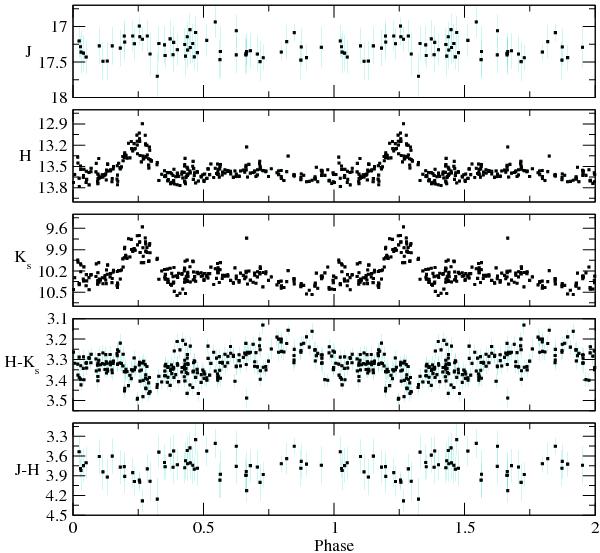
From top to bottom: the J, H, Ks, H − Ks, & J − H phased light and color for YLW 16A, generated using data from the 2MASS Cal-PSWDB as in Fig. 2, folded to a period of 92.6 days and plotted as a function of phase. A second phase of the same data is repeated.
Current usage metrics show cumulative count of Article Views (full-text article views including HTML views, PDF and ePub downloads, according to the available data) and Abstracts Views on Vision4Press platform.
Data correspond to usage on the plateform after 2015. The current usage metrics is available 48-96 hours after online publication and is updated daily on week days.
Initial download of the metrics may take a while.