Fig. 2
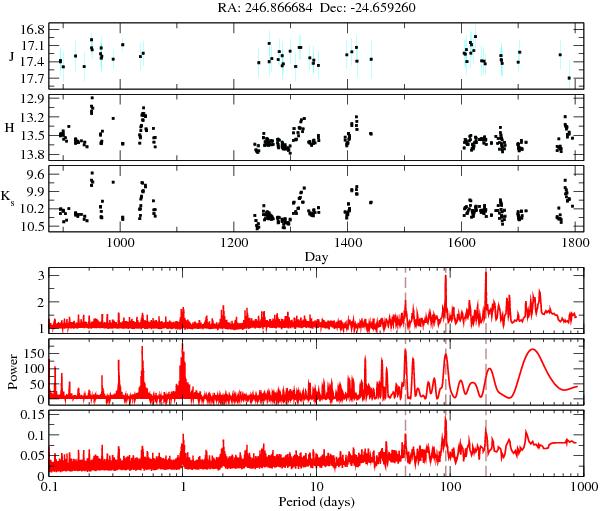
Top three panels: the J, H, & Ks-band light curves for YLW 16A, generated using data from the 2MASS Cal-PSWDB. “Scan groups” of six measurements taken in 10 min of elapsed real time are co-added, as in Plavchan et al. (2008b). Propagated 1σ error bars are shown in teal. Bottom three panels: Plavchan, Lomb-Scargle and Box Least Squares periodograms of the Ks-band light curve (Scargle 1982; Kovacs et al. 2002; Plavchan et al. 2008b).
Current usage metrics show cumulative count of Article Views (full-text article views including HTML views, PDF and ePub downloads, according to the available data) and Abstracts Views on Vision4Press platform.
Data correspond to usage on the plateform after 2015. The current usage metrics is available 48-96 hours after online publication and is updated daily on week days.
Initial download of the metrics may take a while.