Fig. 9
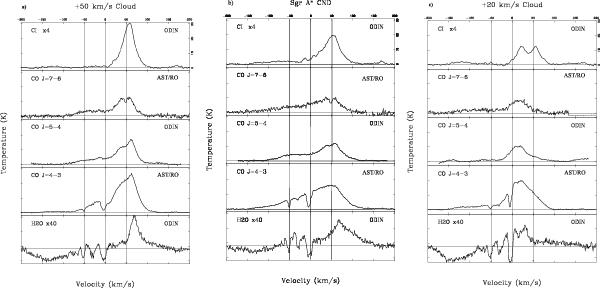
Odin C i, CO J = 5−4, and H2O profiles towards a) the +50 km s-1 cloud, b) the CND, and c) the +20 km s-1 cloud. The H2O zero-line is nominally drawn at the 8 K level. Note that the H2O and C i intensities have been multiplied by factors of 40 and 4, respectively. Odin-beam-smoothed ground-based observations of the J = 4−3 and J = 7−6 transitions of CO (Martin et al. 2004), are included for comparison. The velocity scale (−200 to 200 km s-1) is shown on top of the diagrams, and the temperature scale (−2 to 31 K) is on the top right side in each diagram.
Current usage metrics show cumulative count of Article Views (full-text article views including HTML views, PDF and ePub downloads, according to the available data) and Abstracts Views on Vision4Press platform.
Data correspond to usage on the plateform after 2015. The current usage metrics is available 48-96 hours after online publication and is updated daily on week days.
Initial download of the metrics may take a while.