Fig. 2
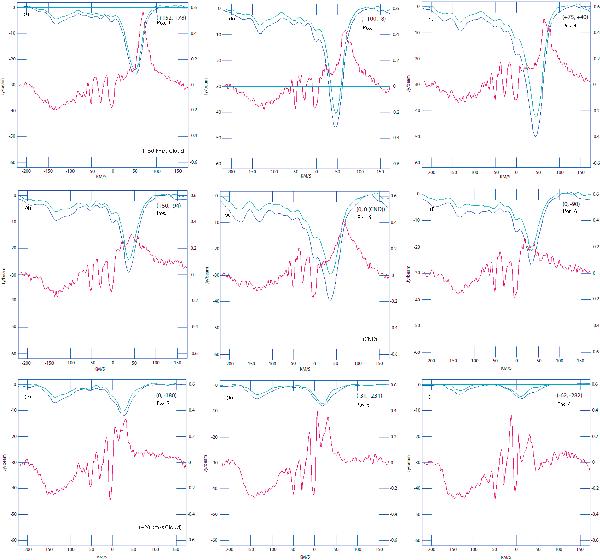
1665 and 1667 MHz OH absorption and the H2O profiles towards the Sgr A complex. The upper (cyan) line profiles refer to the 1665 MHz OH line, and the deeper (blue) absorption profiles belong to the 1667 MHz OH line. The (red) profiles in the middle of the diagrams are the H2O profiles. The scale on the left side of the diagrams (0 to −60 Jy/beam) corresponds to the OH absorption, and the scale on the right side (±0.6 K) is the antenna temperature of the H2O profiles. The equatorial offset coordinates from Sgr A* are given in the upper right corner in each figure. Our high resolution OH data have been convolved here with a 126′′ circular beam to resemble the angular resolution of the Odin H2O data.
Current usage metrics show cumulative count of Article Views (full-text article views including HTML views, PDF and ePub downloads, according to the available data) and Abstracts Views on Vision4Press platform.
Data correspond to usage on the plateform after 2015. The current usage metrics is available 48-96 hours after online publication and is updated daily on week days.
Initial download of the metrics may take a while.