Fig. 11
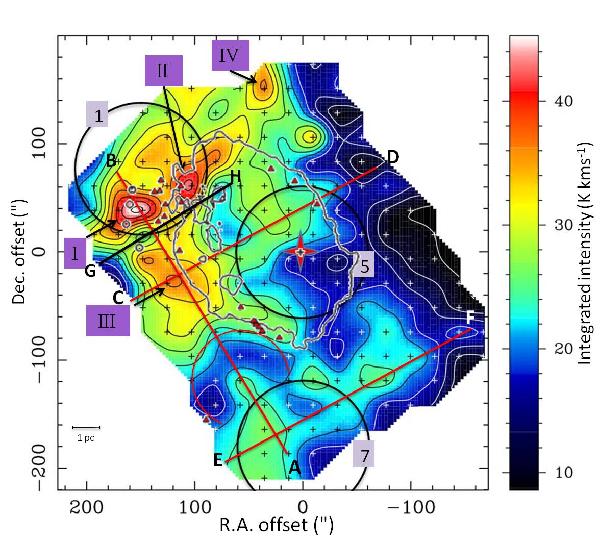
Total integrated intensity (−200 to 200 km s-1) of antenna temperature of SEST observations of C18O J = 2−1 towards the Sgr A complex. Sgr A* is marked with a red star, and the large circles mark the main positions of the +50 km s-1 cloud (1), the CND (5), and the +20 km s-1 cloud (7). The red lines and letters indicate the directions of position-velocity diagrams discussed in Sects. 3.5.2, and 3.5.3, and the Roman numerals refer to objects discussed in the same sections. The black line G−H indicates the position of the velocity cut shown in Fig. 14. The grey contour line delineates the Sgr A East 18-cm continuum emission at 0.15 Jy/beam (Karlsson et al., in prep.). The small grey circles, near Component I, indicate the positions of the four compact H ii regions (Ekers et al. 1983). The red triangles indicate positions of 1720 MHz OH Supernova Remnant (SNR) masers observed by Yusef-Zadeh et al. (1996, 2001), Karlsson et al. (2003), and Sjouwerman & Pihlström (2008). The red arc line indicates the expanding shell associated with the SNR (G359.92−0.09). Offsets in the map are in arcseconds in the equatorial coordinate system, and relative to the position of Sgr A*. The HPBW is 24′′.
Current usage metrics show cumulative count of Article Views (full-text article views including HTML views, PDF and ePub downloads, according to the available data) and Abstracts Views on Vision4Press platform.
Data correspond to usage on the plateform after 2015. The current usage metrics is available 48-96 hours after online publication and is updated daily on week days.
Initial download of the metrics may take a while.