Free Access
Fig. 7
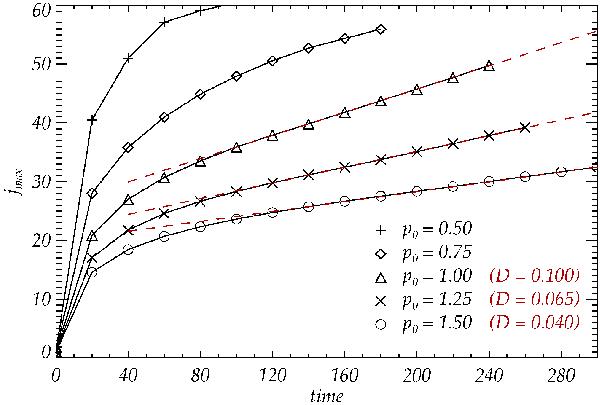
Time evolution of the peak current for five experiments with different initial plasma pressures and an initial current of jf = 1. When a good asymptotic regime is achieved, a fit of jmax = C + Dt is overplotted (red dashed line).
Current usage metrics show cumulative count of Article Views (full-text article views including HTML views, PDF and ePub downloads, according to the available data) and Abstracts Views on Vision4Press platform.
Data correspond to usage on the plateform after 2015. The current usage metrics is available 48-96 hours after online publication and is updated daily on week days.
Initial download of the metrics may take a while.