Fig. 4
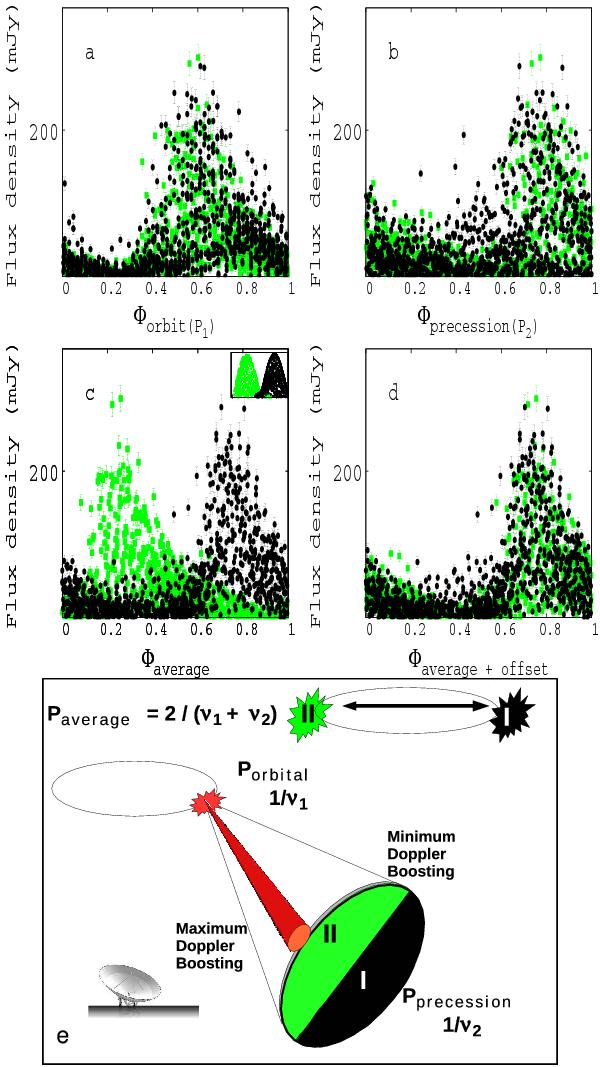
a) Radio light curves (data averaged over 1 d) vs. Φorbit, with Φorbit related to  , with P1 = 26.49 d and t0 = JD2 443 366.775 (Gregory 2002), before (black) and after (green) (2 400 000.5 + 50 841)JD (see Appendix). b) Same as a) but for Φprecession, related to P2. c) Radio light curves vs. Φaverage for Paverage = 26.70 d. The small window shows the simulated data (Eq. (2)) identically folded. d) Radio light curve vs. Φaverage with t0 changed by Δt (Δt = 0 before (2 400 000.5 + 50 841)JD and Δt = 13.25 d after it, see Appendix). e) Sketch of the precessing jet in LS I +61°303 (out of scale).
Current usage metrics show cumulative count of Article Views (full-text article views including HTML views, PDF and ePub downloads, according to the available data) and Abstracts Views on Vision4Press platform.
Data correspond to usage on the plateform after 2015. The current usage metrics is available 48-96 hours after online publication and is updated daily on week days.
Initial download of the metrics may take a while.