Fig. 3
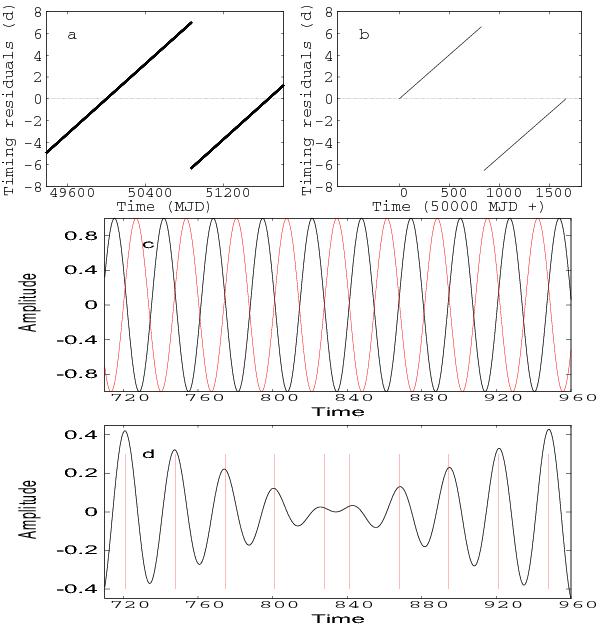
a) Sawtooth function based on timing residuals observed by Gregory et al. (1999). b) Sawtooth function based on the loss of synchronization of the sine functions f(P1) and f(P2) of Fig. 3c. c) Sine waves with periods P1 (black line) and P2 (red line) starting with synchronized peaks at t = 0. d) Sum of the sine waves. The first five bars are at a regular interval equal to Paverage, then the next bar follows at a distance of only 13.25 d (P1/2), followed by four bars again at a regular interval equal to Paverage as before. The two central bars are symmetric with respect to a peak of f(P2) (Fig. 3c) that is nearly equidistant from the preceeding peak and the delayed peak of f(P1) (see Appendix).
Current usage metrics show cumulative count of Article Views (full-text article views including HTML views, PDF and ePub downloads, according to the available data) and Abstracts Views on Vision4Press platform.
Data correspond to usage on the plateform after 2015. The current usage metrics is available 48-96 hours after online publication and is updated daily on week days.
Initial download of the metrics may take a while.