Fig. 1
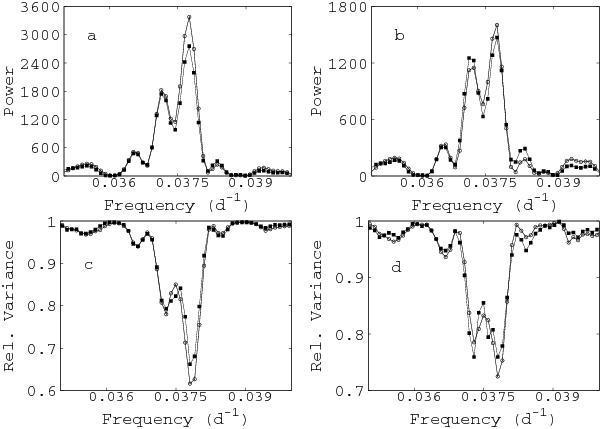
Periodograms of 8.3 GHz (filled squares) and 2.2 GHz (circles) data. a) Output of Lomb-Scargle method. The Lomb-Scargle analysis gives on the y-axis the significance of the frequency. Two frequencies are found at ν1 = 0.03775 d-1 (P1 = 26.49 d) and at ν2 = 0.03715 d-1 (P2 = 26.92 d). b) Output of Lomb-Scargle method for data ≥4σ. c) Output of PDM. The most likely period yields the minimum dispersion and appears as a minimum in the PDM curve, i.e., specular to the maximum in the Lomb-Scargle plot. d) Output of PDM for data ≥4σ.
Current usage metrics show cumulative count of Article Views (full-text article views including HTML views, PDF and ePub downloads, according to the available data) and Abstracts Views on Vision4Press platform.
Data correspond to usage on the plateform after 2015. The current usage metrics is available 48-96 hours after online publication and is updated daily on week days.
Initial download of the metrics may take a while.