Free Access
Fig. 6
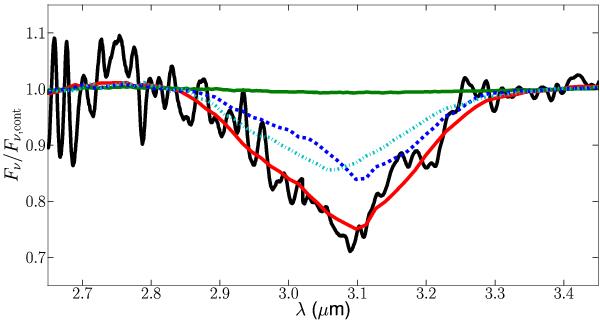
3.1 μm ice absorption feature. The continuum-divided ISO-SWS data are shown in black. The red curve gives the best fit model and the green curve gives the model without H2O ice. The dashed blue and dotted cyan curve give the contributions from crystalline and amorphous H2O ice, respectively.
Current usage metrics show cumulative count of Article Views (full-text article views including HTML views, PDF and ePub downloads, according to the available data) and Abstracts Views on Vision4Press platform.
Data correspond to usage on the plateform after 2015. The current usage metrics is available 48-96 hours after online publication and is updated daily on week days.
Initial download of the metrics may take a while.