Fig. 5
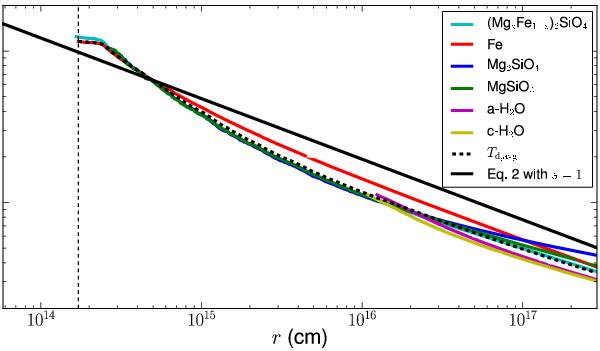
Dust-temperature profiles for OH 127.8+0.0 as modeled with MCMax. The full colored lines indicate the specific dust species: cyan for amorphous silicates, red for metallic iron, blue for forsterite, green for enstatite, magenta for amorphous H2O ice, and yellow for crystalline H2O ice. Each of these profiles are cut off at the condensation temperature. The dashed black line gives the mean dust temperature profile. The full black line shows the power law from Eq. (2), with s = 1. The vertical dashed line indicates the inner radius of the dust shell.
Current usage metrics show cumulative count of Article Views (full-text article views including HTML views, PDF and ePub downloads, according to the available data) and Abstracts Views on Vision4Press platform.
Data correspond to usage on the plateform after 2015. The current usage metrics is available 48-96 hours after online publication and is updated daily on week days.
Initial download of the metrics may take a while.