Fig. 3
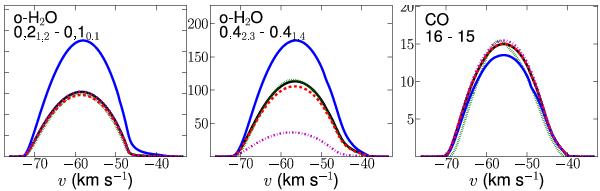
Line profile predictions for the high mass-loss-rate case Ṁg = 5.0 × 10⁻⁵ M⊙ yr-1. The full black curve corresponds to the standard model with the inner radius of the gas shell Ri,g = 3 R⋆ , the black extinction efficiency profile from Fig. 2 and ψ = 0.01. In all other models only a single property is modified. The dotted green curve (which coincides with the other curves) assumes Ri,g = 10 R⋆ , the full blue and dashed red curves apply the blue and red extinction efficiency profiles from Fig. 2 and the dashed-dotted magenta curve assumes ψ = 0.001 (see Sect. 3.6 for more details).
Current usage metrics show cumulative count of Article Views (full-text article views including HTML views, PDF and ePub downloads, according to the available data) and Abstracts Views on Vision4Press platform.
Data correspond to usage on the plateform after 2015. The current usage metrics is available 48-96 hours after online publication and is updated daily on week days.
Initial download of the metrics may take a while.