Fig. 12
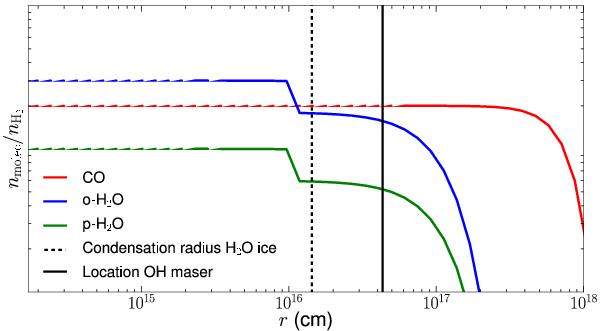
Schematic representation of the CO (red), the ortho-H2O (blue), and para-H2O (green) abundance profiles. The vertical dashed black line indicates the H2O ice condensation radius. The vertical full black line indicates the location of the OH 1612 MHz maser shell, assuming a distance of 2100 pc. The signal-to-noise of the PACS is too low to trace the drop in H2O vapor abundance (shown here for a freeze-out of ~40%) at the H2O ice condensation radius.
Current usage metrics show cumulative count of Article Views (full-text article views including HTML views, PDF and ePub downloads, according to the available data) and Abstracts Views on Vision4Press platform.
Data correspond to usage on the plateform after 2015. The current usage metrics is available 48-96 hours after online publication and is updated daily on week days.
Initial download of the metrics may take a while.