Fig. 9
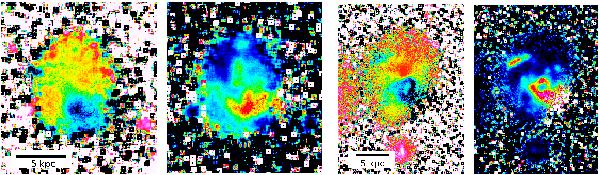
Target galaxies No. 7, J100712.21+065735.6 (left pair) and No. 3, J025325.28-001356.6 (right pair). The left image in each pair shows the colour distribution based on the ratio between the fluxes in the B and Hα -continua, index B-EMMI768. Blue/dark regions map young stars and red/light-grey regions map old stars. The image on the right in each pair shows a map of EW(Hα), ranging between 0 and 200 Å in the galaxy on the left and between 0 and 600 Å in the galaxy to the right (white regions are higher values). Blue/dark regions have low equivalent widths, red/light-grey have high equivalent widths. The images have been selectively (depending on the local S/N) filtered with a median boxcar filter, using the MIDAS task filter/smooth. North is up, east is to the left. The fieldsizes are 24′′ × 26′′ and 36′′ × 48′′ respectively (online version in colour).
Current usage metrics show cumulative count of Article Views (full-text article views including HTML views, PDF and ePub downloads, according to the available data) and Abstracts Views on Vision4Press platform.
Data correspond to usage on the plateform after 2015. The current usage metrics is available 48-96 hours after online publication and is updated daily on week days.
Initial download of the metrics may take a while.