Fig. 4
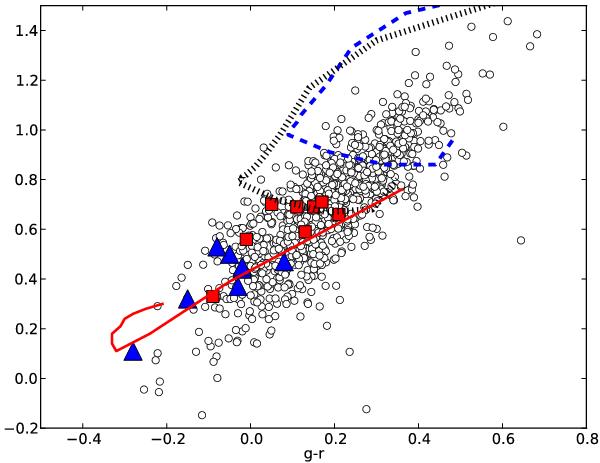
Comparison between model predictions and observed colours. The observed target colours are marked with squares. The triangles show the colours after correction for dust attenuation assuming a homogeneous foreground screen. The open circles show a random sample of 1000 star forming SDSS galaxies at z = 0.03 with 20 ≤ EW(Hα) ≤ 200 Å, also corrected for dust reddening. All corrections are based on the Hα /Hβ ratio and are relevant for redshift z = 0.03 and 40% solar metallicity. Typical errors in the colours are 0.03−0.04 mag but some of the outliers may be faint galaxies with large errors. Overlaid are tracks showing Zackrisson et al. (2001) model colours of galaxies with and without LyC leakage. Only parts of the evolutionary tracks where the EW criterion is fulfilled are shown. We look for cases which can be approximated by a mixture of a starburst with constant star formation rate and an old component. The duration of the starburst is 10 Myr. These tracks can be characterized by two parameters: 1) the birthrate parameter b, i.e. the ratio between present star formation rate and the mean past star formation rate, 2) fesc. The age of the old component was assumed to be 10 Gyr. The lines represent the following scenarios: Hatched: b = 1, fesc = 0; Dotted: b = 2, fesc = 0.4; Solid: b = 30, fesc = 0.95. The temporal evolution is from the top of the diagram. In the upper tracks we notice a kink on the blue side. This marks the end of the starburst. The nearly horizontal part of the two upper tracks correspond to the post-starburst phase. (Online version in colour.)
Current usage metrics show cumulative count of Article Views (full-text article views including HTML views, PDF and ePub downloads, according to the available data) and Abstracts Views on Vision4Press platform.
Data correspond to usage on the plateform after 2015. The current usage metrics is available 48-96 hours after online publication and is updated daily on week days.
Initial download of the metrics may take a while.