Fig. 9
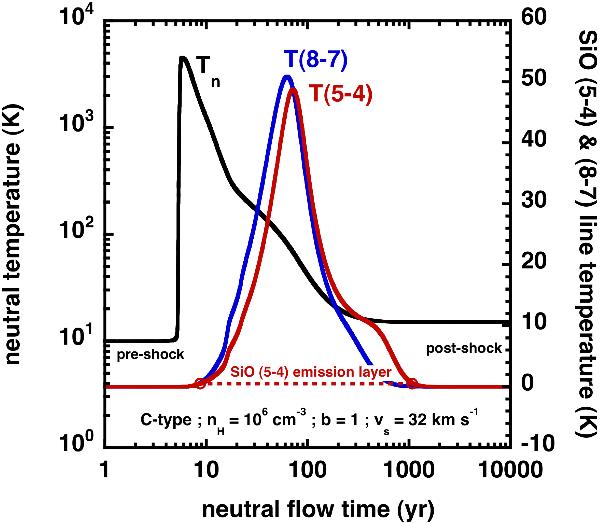
Neutral temperature (black line) and the SiO (5−4) and (8−7) line temperature (red and blue lines) profiles over the whole shock layer, seen face-on, versus the neutral flow time for our best-fitting model. The characteristics of this model are indicated in the figure, as well as the location of pre- and post-shock regions. Our definition of the SiO (5−4) emission region (Sect. 4.2) is also delimited by the two red open circles and is represented by the horizontal dashed red line. In this diagram, the line of sight lies on the plane of the figure, in the direction that goes from the pre- to the post-shock region.
Current usage metrics show cumulative count of Article Views (full-text article views including HTML views, PDF and ePub downloads, according to the available data) and Abstracts Views on Vision4Press platform.
Data correspond to usage on the plateform after 2015. The current usage metrics is available 48-96 hours after online publication and is updated daily on week days.
Initial download of the metrics may take a while.