Fig. 8
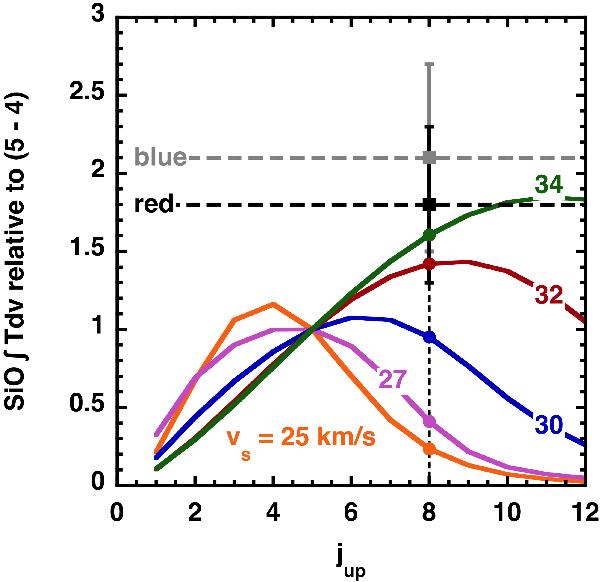
Integrated intensities of the SiO lines relative to SiO(5−4). The horizontal lines show the values of the SiO(8–7) to (5−4) ratio, whether it is the one in the blue or red lobe of the outflow. The vertical line marks the position of the (8–7) transition on the X-axis. The colour curves provide the results for the fraction of our C-type shock models grid relevant to our study. For all these models, the pre-shock density is nH = 106 cm-3, and the magnetic field parameter is b = 1. Only the shock velocity νs varies, and is indicated for each model on the corresponding line. The blue- and red-velocity range are defined in Fig. 6.
Current usage metrics show cumulative count of Article Views (full-text article views including HTML views, PDF and ePub downloads, according to the available data) and Abstracts Views on Vision4Press platform.
Data correspond to usage on the plateform after 2015. The current usage metrics is available 48-96 hours after online publication and is updated daily on week days.
Initial download of the metrics may take a while.