Fig. 6
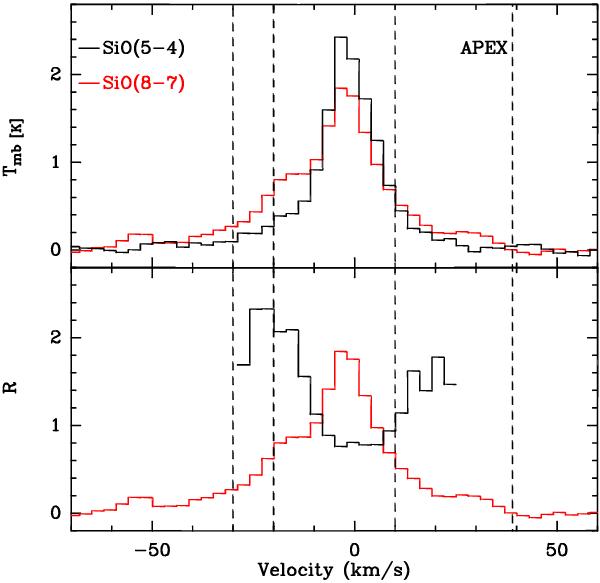
Upper panel: APEX spectra of the SiO(5−4) and (8–7) lines in the OF1 region around IRAS 17233-3606 observed at  , δ[J2000] = − 36°09′20″. Lower panel: SiO(8–7)/SiO(5−4) line ratio as function of velocity (black line). The red line is the SiO(8–7) spectrum. The dashed lines mark the velocity ranges used in Sect. 4, blue [− 30, − 20], and red [+ 10, + 39] km s-1.
Current usage metrics show cumulative count of Article Views (full-text article views including HTML views, PDF and ePub downloads, according to the available data) and Abstracts Views on Vision4Press platform.
Data correspond to usage on the plateform after 2015. The current usage metrics is available 48-96 hours after online publication and is updated daily on week days.
Initial download of the metrics may take a while.