Fig. 5
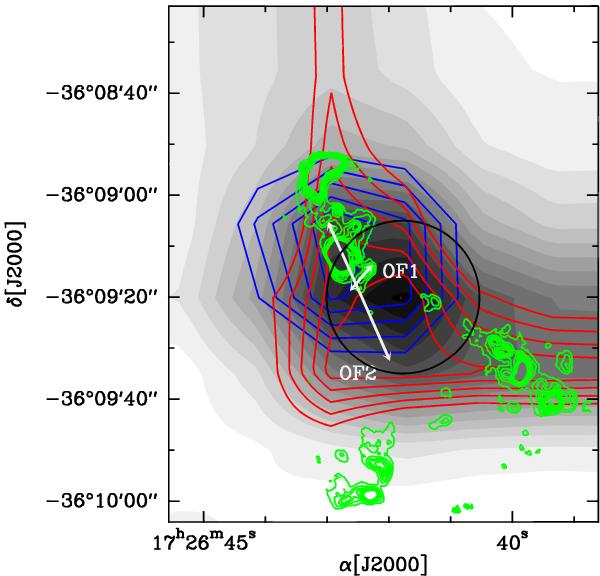
Total integrated intensity (−40 < ν < 40 km s-1; grey shades are from 10% of the peak emission, 43 K k ms-1, in steps of 5%) of the SiO(5−4) transition observed with APEX. The red and blue contours are the red- (5 < ν < 40 km s-1) and blue-shifted (−40 < ν < −5 km s-1) integrated emission observed with APEX (contours are 50% of the peak emission (9.4 K k ms-1 for the red emission, 17.6 K k ms-1 for the blue emission) in steps of 10%). The green contours represent the 2.12 μm H2 emission. The white arrows label the OF1 and OF2 outflows. The black circle marks the APEX beam centred on the peak of the APEX SiO emission, as in Fig. 2.
Current usage metrics show cumulative count of Article Views (full-text article views including HTML views, PDF and ePub downloads, according to the available data) and Abstracts Views on Vision4Press platform.
Data correspond to usage on the plateform after 2015. The current usage metrics is available 48-96 hours after online publication and is updated daily on week days.
Initial download of the metrics may take a while.