Free Access
Fig. 3
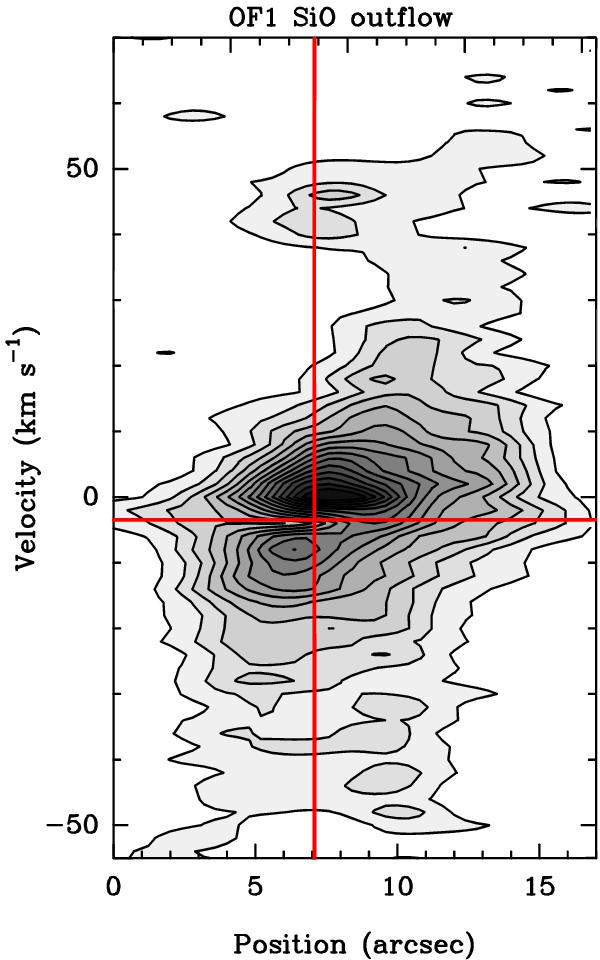
Position-velocity diagram of the SiO(5−4) transition (SMA data) along the OF1 axis shown in Fig. 1. The vertical line marks the mm continuum peak, the horizontal line the ambient velocity (− 3.4 km s-1, Bronfman et al. 1996). Contours are from 2σ (0.2 Jy/beam) in steps of 4σ.
Current usage metrics show cumulative count of Article Views (full-text article views including HTML views, PDF and ePub downloads, according to the available data) and Abstracts Views on Vision4Press platform.
Data correspond to usage on the plateform after 2015. The current usage metrics is available 48-96 hours after online publication and is updated daily on week days.
Initial download of the metrics may take a while.