Free Access
Fig. A.1
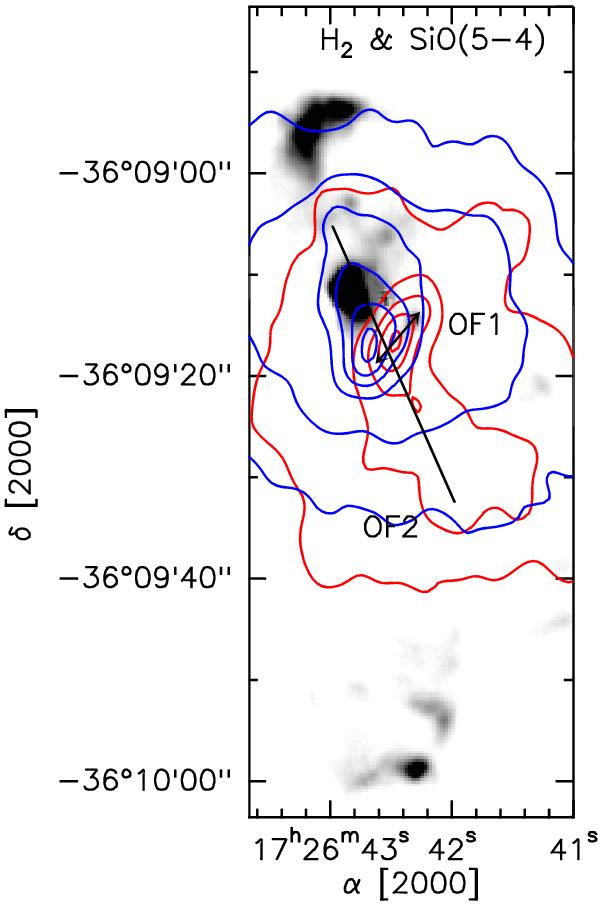
Integrated emission of the SiO(5−4) line in the SMA+APEX combined data. The blue and red contours are the blue- and red-shifted emission (νbl = [−50, −20] km s-1, from 10σ (1 Jy/beam) in steps of 10σ; νrd = [+10, +39] km s-1, from 10σ (1 Jy/beam) in steps of 10σ). The grey image represents the H2 emission at 2.12 μm.
Current usage metrics show cumulative count of Article Views (full-text article views including HTML views, PDF and ePub downloads, according to the available data) and Abstracts Views on Vision4Press platform.
Data correspond to usage on the plateform after 2015. The current usage metrics is available 48-96 hours after online publication and is updated daily on week days.
Initial download of the metrics may take a while.