Fig. 10
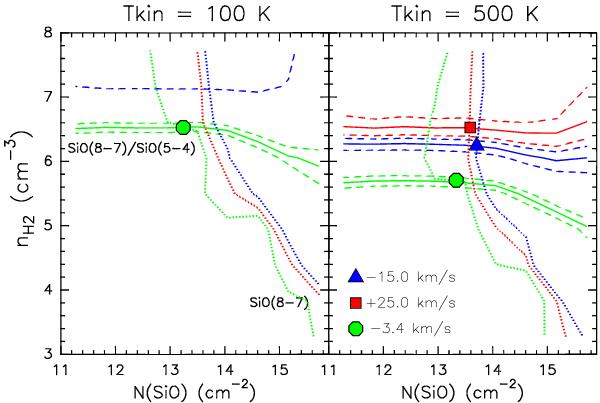
Volume density nH2 versus SiO column density, N(SiO) for slab-LVG models for Tkin = 100 K (left panel) and 500 K (right). Each continuous curve corresponds to the observed SiO(8–7)/SiO(5−4) intensity ratio (after convolution to the same resolution, see Sect. 2.1), as measured at ambient velocity (−3.4 km s-1, green curve) and at typical red- (+25.0 km s-1, red curve) and blue-shifted (–15.0 km s-1, blue curve) velocities. Dashed lines are for the ratio uncertainties. The dotted curves correspond to the APEX SiO(8–7) values at the same velocities, after correction for beam dilution using the OF1 size as derived from the SMA data. The corresponding uncertainties are negligible and are not shown for the sake of clarity. The symbols (circle: ambient; square: red; triangles: blue) indicate the allowed solutions.
Current usage metrics show cumulative count of Article Views (full-text article views including HTML views, PDF and ePub downloads, according to the available data) and Abstracts Views on Vision4Press platform.
Data correspond to usage on the plateform after 2015. The current usage metrics is available 48-96 hours after online publication and is updated daily on week days.
Initial download of the metrics may take a while.