Fig. 1
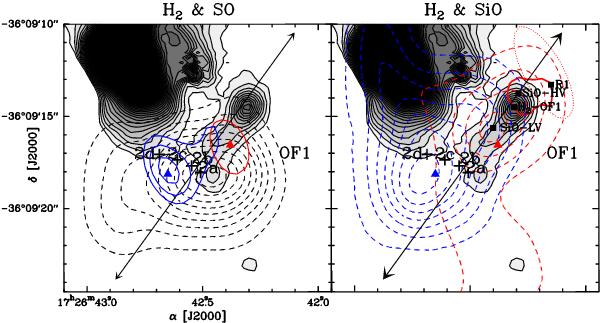
Left: dashed contours (from 10σ, 0.23 Jy/beam, in step of 10σ) are the 1.4 mm continuum emission observed with the SMA. The solid blue and red contours are the SO(56 − 45) blue- and red-shifted emission from Paper I (blue: from 80 to 104 Jy beam-1 in steps of 10 Jy beam-1; red: 10 and 12 Jy beam-1). Right: integrated emission of the SiO(5−4) line: the dashed blue and red contours are the LV blue- and red-shifted SiO emission (νbl = [− 20, − 10] km s-1, from 5σ (2.5 Jy/beam) in step of 10σ; νrd = [+ 10, + 39] km s-1, from 5σ (4 Jy/beam) in step of 10σ), the thick contour the HV red-shifted emission (νrd = [+ 50, + 70] km s-1, 4σ (2.4 Jy/beam)). The red dotted contour is the EHV CO(2–1) red-shifted emission (see Fig. 3 of Paper I). The black squares mark the peak positions of the EHV CO(2–1) (R1) red-shifted emission, of the SiO(5−4) LV (SiO-LV) and HV red-shifted emission (SiO-HV) , and of the H2 emission in OF1 (H2-OF1). In both panels, the grey scale and the solid black contours represent the H2 emission at 2.12 μm. The black crosses mark the positions of the VLA-2a,-2b,-2c and -2d 1.3 cm continuum sources (Zapata et al. 2008); the arrow marks the OF1 outflow. The blue and red triangles mark the peaks of the blue- and red-shifted SO(56 − 45) emission.
Current usage metrics show cumulative count of Article Views (full-text article views including HTML views, PDF and ePub downloads, according to the available data) and Abstracts Views on Vision4Press platform.
Data correspond to usage on the plateform after 2015. The current usage metrics is available 48-96 hours after online publication and is updated daily on week days.
Initial download of the metrics may take a while.