Fig. 6
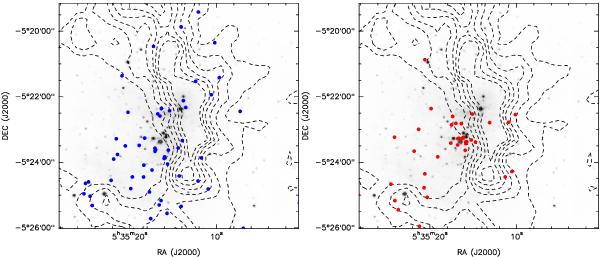
Proplyds from the Kastner et al. (2005) catalog with X-ray counterparts. The gray scale is the 2MASS image at K band, and the dashed contours denote the CN N = 1–0 emission from the OMC (Rodríguez-Franco et al. 1998). Left: stars with measured values of the hydrogen column density of log NH < 22.0 cm-2. Right: stars with measured values of the hydrogen column density of log NH > 22.0 cm-2.
Current usage metrics show cumulative count of Article Views (full-text article views including HTML views, PDF and ePub downloads, according to the available data) and Abstracts Views on Vision4Press platform.
Data correspond to usage on the plateform after 2015. The current usage metrics is available 48-96 hours after online publication and is updated daily on week days.
Initial download of the metrics may take a while.