Fig. 5
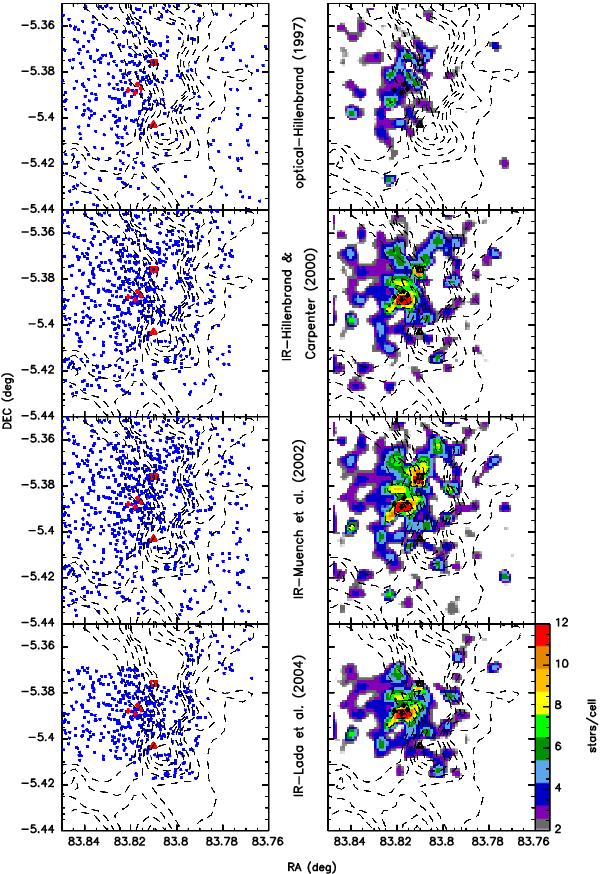
Spatial distribution of stars from four different surveys. From upper to lower panels: optical catalog (V and IC bands) from Hillenbrand (1997), IR catalog (H and K bands) from Hillenbrand Carpenter (2000), IR catalog (J, H and KS bands) from Muench et al. (2002), and IR catalog (L′ band) from Lada et al. (2004). As in Fig. 1, dashed contours represent dense gas traced by the integrated intensity emission of CN (N = 1–0) (Rodríguez-Franco et al. 1998). The left panels show the position of the X-ray stars as blue dots. Four crosses, an open square and an open triangle show the location of the four main-sequence massive Trapezium stars, the OHC, and OMC1-S. The right panels report the stellar surface density for the same extinction ranges, derived by counting the number of COUP sources using a kernel box of 15′′ (0.03 pc) (right color scale), superimposed on the CN emission.
Current usage metrics show cumulative count of Article Views (full-text article views including HTML views, PDF and ePub downloads, according to the available data) and Abstracts Views on Vision4Press platform.
Data correspond to usage on the plateform after 2015. The current usage metrics is available 48-96 hours after online publication and is updated daily on week days.
Initial download of the metrics may take a while.