Fig. 4
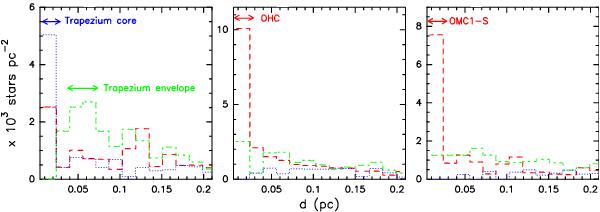
Surface stellar density versus the distance to the PMS cluster center for the TC (left), the OHC (middle), and OMC1-S (right). The different colors and dashed lines show different extinction ranges: green corresponds to log NH < 22.0 cm-2, blue indicates an extinction range of 22.0 cm-2 < log NH < 22.5 cm-2, and red corresponds to log NH > 22.5 cm-2.
Current usage metrics show cumulative count of Article Views (full-text article views including HTML views, PDF and ePub downloads, according to the available data) and Abstracts Views on Vision4Press platform.
Data correspond to usage on the plateform after 2015. The current usage metrics is available 48-96 hours after online publication and is updated daily on week days.
Initial download of the metrics may take a while.