Fig. 2
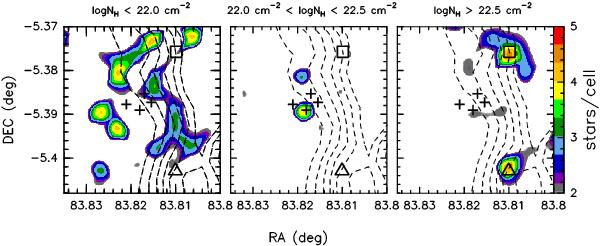
Zoom of the central region from Fig. 1. The color contours represent the stellar surface density (number of COUP sources using a cell box of 0.03 pc × 0.03 pc, right color scale) for the three extinction ranges (log NH < 22.0 cm-2 in the left panel; 22.0 cm-2 < log NH < 22.5 cm-2 in the middle panel; and log NH > 22.5 cm-2 in the right panel). The color contours have been smoothed for display purposes. As in Fig. 1, the dashed contours represent the CN emission, and the four crosses, the open square, and the open triangle show the location of the four main-sequence massive Trapezium stars, the OHC, and the OMC1-S.
Current usage metrics show cumulative count of Article Views (full-text article views including HTML views, PDF and ePub downloads, according to the available data) and Abstracts Views on Vision4Press platform.
Data correspond to usage on the plateform after 2015. The current usage metrics is available 48-96 hours after online publication and is updated daily on week days.
Initial download of the metrics may take a while.