Fig. 1
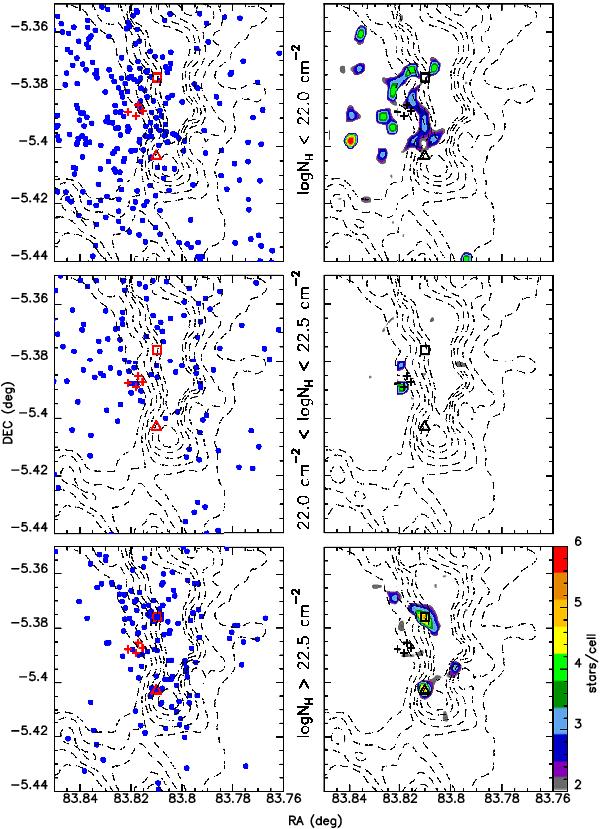
Spatial distribution of low-mass stars for three different extinction ranges: log NH < 22.0 cm-2 (upper panels), 22.0 cm-2 < log NH < 22.5 cm-2 (middle panels), and log NH > 22.5 cm-2 (lower panels). Dashed contours represent dense gas traced by the integrated intensity emission of CN (N = 1–0) (Rodríguez-Franco et al. 1998). The first contour level corresponds to 7 K km s-1, the interval between contours is 4 K km s-1. The left panels show the position of the X-ray stars as blue dots. Four crosses, the open square, and the open triangle show the location of the four main sequence massive Trapezium stars, the OHC, and the OMC1-S. The right panels report the stellar surface density for the same extinction ranges, derived by counting the number of COUP sources using a cell size of 15′′ × 15′′ (0.03 pc × 0.03 pc) (right color scale), superimposed on the CN emission. The color contours have been smoothed for display purposes.
Current usage metrics show cumulative count of Article Views (full-text article views including HTML views, PDF and ePub downloads, according to the available data) and Abstracts Views on Vision4Press platform.
Data correspond to usage on the plateform after 2015. The current usage metrics is available 48-96 hours after online publication and is updated daily on week days.
Initial download of the metrics may take a while.