Fig. 9
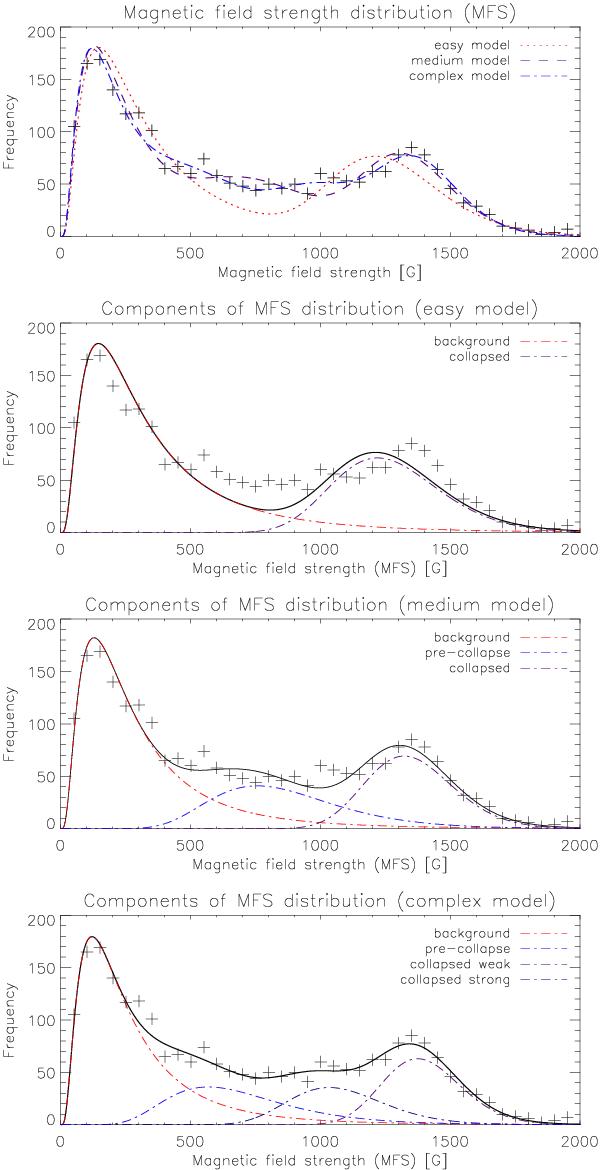
Top panel: simplistic fit model (two log-normal components) applied to data set I (red, short dashed line) compared to a medium complex model consisting of 3 log-normal components (purple, long dashed line) and a sophisticated (4 log-normal components) model blue, short/long dashed line). Second panel: illustration of the components of the simplistic model. Third panel: components of the medium complex model. Fourth panel: components of the sophisticated fitting model, which assumes two strong magnetic field components around 1000 G and 1300 G, respectively. The reduced χ2 value for the simplistic model is 3.9 compared to 1.3 for the medium complex model and 0.8 for the most sophisticated one.
Current usage metrics show cumulative count of Article Views (full-text article views including HTML views, PDF and ePub downloads, according to the available data) and Abstracts Views on Vision4Press platform.
Data correspond to usage on the plateform after 2015. The current usage metrics is available 48-96 hours after online publication and is updated daily on week days.
Initial download of the metrics may take a while.