Fig. 6
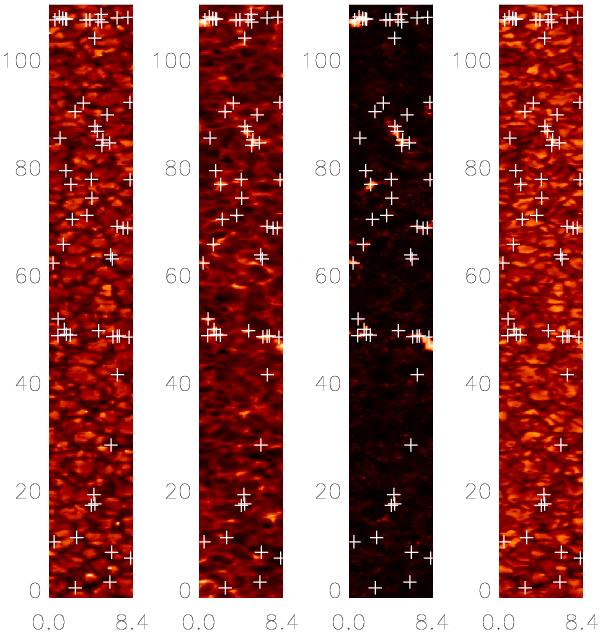
From left to right: continuum image stemming from SP data, CaII-H (chromosphere), magnetic field strength map (inversion of SP data done by MERLIN code), G-band (photosphere). The crosses indicate identified MBPs. It can be clearly seen that no significant magnetic field activity is within the FOV (pores, sunspots). The magnetic field strengths in the data set vary between 3 and 1510 G.
Current usage metrics show cumulative count of Article Views (full-text article views including HTML views, PDF and ePub downloads, according to the available data) and Abstracts Views on Vision4Press platform.
Data correspond to usage on the plateform after 2015. The current usage metrics is available 48-96 hours after online publication and is updated daily on week days.
Initial download of the metrics may take a while.