Fig. 4
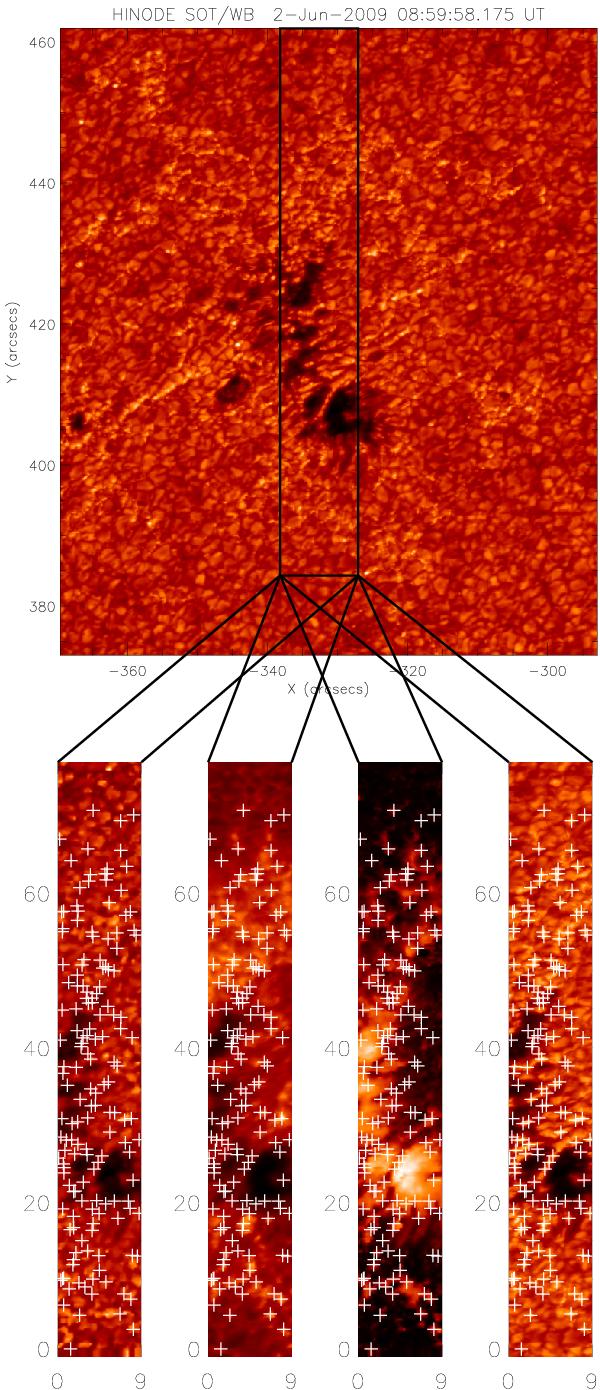
Top: typical G-band filtergram of data set II (active region). The region scanned by the SP instrument is marked by a rectangle. Bottom: available data and identified MBPs (marked by white crosses). From left to right: whitelight image (obtained by inversion; SP data), Ca II-H filtergram (chromosphere), magnetic field strength map (gained by inversion; SP data), and finally a G-band filtergram. The range of the magnetic field strengths for this data is given as 14 to 2580 G.
Current usage metrics show cumulative count of Article Views (full-text article views including HTML views, PDF and ePub downloads, according to the available data) and Abstracts Views on Vision4Press platform.
Data correspond to usage on the plateform after 2015. The current usage metrics is available 48-96 hours after online publication and is updated daily on week days.
Initial download of the metrics may take a while.