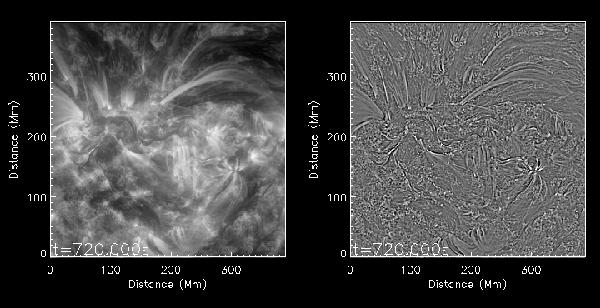
Fig. A.6

Still from Movie 5, showing the region observed by AIA 171 Å that is displayed in Fig. 1 in the main text. The coronal structures labelled A, B, 1, 2 and 3 are all visible in the movie. Note the visible motion in feature 3, in which the analysis finds relatively large velocity amplitude (> 5 km s-1) transverse displacements. This is compared with the other structures, where our analysis revealed only small velocity amplitudes.
Current usage metrics show cumulative count of Article Views (full-text article views including HTML views, PDF and ePub downloads, according to the available data) and Abstracts Views on Vision4Press platform.
Data correspond to usage on the plateform after 2015. The current usage metrics is available 48-96 hours after online publication and is updated daily on week days.
Initial download of the metrics may take a while.


