Fig. 2
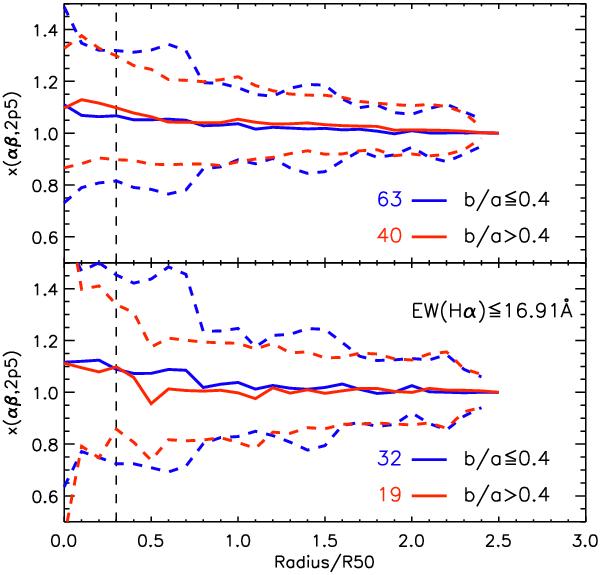
Top: growth curve of f(Hα)/f(Hβ) normalized to f(Hα)/f(Hβ) at 2.5R50, x(αβ,2p5), as a function of the radius of the aperture. Lines and colors as in Fig. 1. For one of the galaxies the Hβ emission line was not detected in all apertures and was not included. Bottom: same as top panel restricted to galaxies with EW(Hα) ≤ 16.91 Å.
Current usage metrics show cumulative count of Article Views (full-text article views including HTML views, PDF and ePub downloads, according to the available data) and Abstracts Views on Vision4Press platform.
Data correspond to usage on the plateform after 2015. The current usage metrics is available 48-96 hours after online publication and is updated daily on week days.
Initial download of the metrics may take a while.