Fig. 1
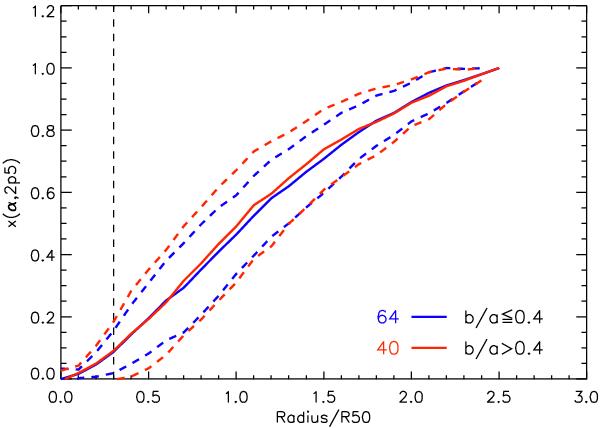
Growth curve of f(Hα) normalized to f(Hα) at 2.5R50, x(α,2p5), as a function of the radius of the aperture. Bold red (blue) lines correspond to the median values for galaxies with b/a > 0.4 (b/a < 0.4). Dashed red and blue lines correspond to 1σ deviations from the median curve. Numbers indicate the size of each subsample. The vertical dashed line corresponds to 0.3R50, which on average corresponds to the FWHM of the CALIFA psf for our sample.
Current usage metrics show cumulative count of Article Views (full-text article views including HTML views, PDF and ePub downloads, according to the available data) and Abstracts Views on Vision4Press platform.
Data correspond to usage on the plateform after 2015. The current usage metrics is available 48-96 hours after online publication and is updated daily on week days.
Initial download of the metrics may take a while.