Fig. 9
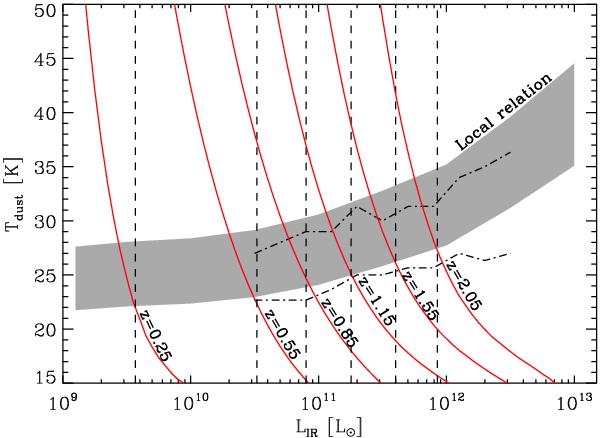
Selection limits introduced in the Tdust−LIR parameter space by our deepest PACS observations, i.e., in GOODS-S-ultradeep. Red continuous lines are these selection limits at different redshifts using our PACS 5σ detection limits. Each line corresponds to the central redshift of our redshift bins, i.e., z = 0.25 (further left), z = 0.55, z = 0.85, z = 1.15, z = 1.55 and z = 2.05 (further right). The shaded area shows the local Tdust−LIR relation found by Chapman et al. (2003), linearly extrapolated to 1013 L⊙. Dot-dashed lines show the Tdust−LIR relation inferred by Symeonidis et al. (2013) using a sample of high-redshift (i.e., 0.2 < z < 1.2) Herschel-detected galaxies. Dashed black lines show, for each redshift, the lowest infrared luminosities probed by our ultradeep PACS observations without any dust temperature biases and yet populated by star-forming galaxies.
Current usage metrics show cumulative count of Article Views (full-text article views including HTML views, PDF and ePub downloads, according to the available data) and Abstracts Views on Vision4Press platform.
Data correspond to usage on the plateform after 2015. The current usage metrics is available 48-96 hours after online publication and is updated daily on week days.
Initial download of the metrics may take a while.