Fig. 6
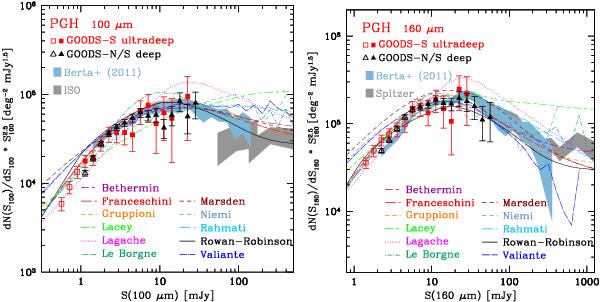
PACS 100 and 160 μm differential number counts, normalized to the Euclidean slope (dN/dS ∝ S-2.5). Filled and open symbols show flux density bins above and below the 80% completeness limit, respectively. Grey shaded areas present estimates obtained using pre-Herschel observations. Blue shaded areas present estimates obtained using PACS observations (Berta et al. 2011). Lines represent predictions from backwards or forwards evolutionary models (Lagache et al. 2004; Rowan-Robinson 2009; Valiante et al. 2009; Le Borgne et al. 2009; Franceschini et al. 2010; Gruppioni et al. 2010; Lacey et al. 2010; Marsden et al. 2011; Rahmati & van der Werf 2011; Niemi et al. 2012; Béthermin et al. 2012).
Current usage metrics show cumulative count of Article Views (full-text article views including HTML views, PDF and ePub downloads, according to the available data) and Abstracts Views on Vision4Press platform.
Data correspond to usage on the plateform after 2015. The current usage metrics is available 48-96 hours after online publication and is updated daily on week days.
Initial download of the metrics may take a while.