Fig. 5
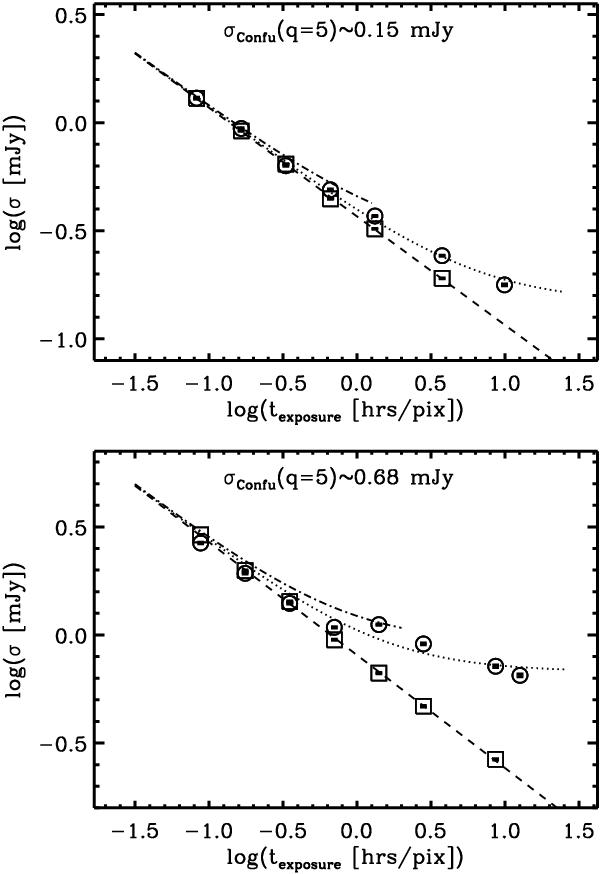
Noise in the PACS-100 μm (top panel) and PACS-160 μm (bottom panel) maps as a function of exposure time. Empty circles represent the total noise σT of the maps. The total noise is fitted with two noise components added in quadrature: an instrumental noise σI component following a t-0.5 trend (dashed line and empty squares) and an constant confusion noise σc component. The dotted lines present the two components fitted to σT. The dot-dashed lines present the two components fitted to σT made in Berta et al. (2011) and illustrate the smaller exposure time range probed in their study.
Current usage metrics show cumulative count of Article Views (full-text article views including HTML views, PDF and ePub downloads, according to the available data) and Abstracts Views on Vision4Press platform.
Data correspond to usage on the plateform after 2015. The current usage metrics is available 48-96 hours after online publication and is updated daily on week days.
Initial download of the metrics may take a while.