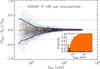
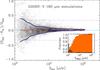
Fig. 4
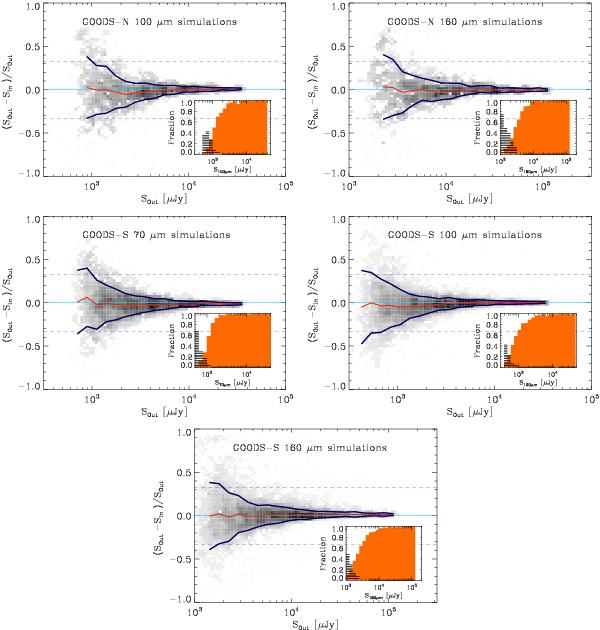
Results of MC simulations in the GOODS-North and -South fields using the prior source extraction method. These MC simulations correspond to the central deepest regions of each field, i.e., avoiding the rather noisy edges of the GOODS-N field and concentrating on the GOODS-S-ultradeep part of the GOODS-S field. Blue lines represent the average photometric accuracy defined as the standard deviation of the (Sout − Sin)/Sout distribution in each flux bin (after 3σ clipping). Red lines show the mean value of the (Sout − Sin)/Sout distribution in each flux bin. Inset plots show the fraction of artificial sources detected in the image (i.e., completeness) as a function of input flux (orange plain histogram) and the fraction of spurious sources (i.e., contamination) as a function of flux density (striped black histogram).
Current usage metrics show cumulative count of Article Views (full-text article views including HTML views, PDF and ePub downloads, according to the available data) and Abstracts Views on Vision4Press platform.
Data correspond to usage on the plateform after 2015. The current usage metrics is available 48-96 hours after online publication and is updated daily on week days.
Initial download of the metrics may take a while.