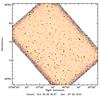
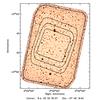
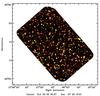
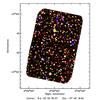
Fig. 2
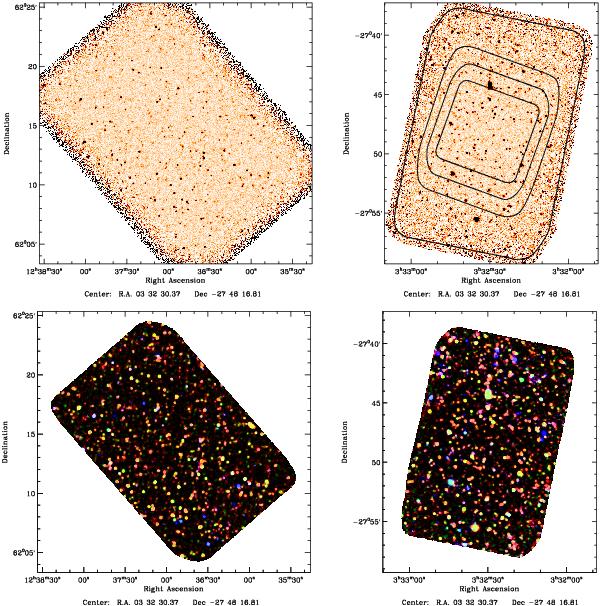
(Top left) PEP/GOODS-H map of the GOODS-north field (11′ × 17′) at 100 μm. (Top right) PEP/GOODS-H map of the GOODS-south field (11′ × 17′) at 100 μm. Contours correspond to exposure times greater than 0.5 (at the edge), 3, 6 and 9 (centre) hrs/pix. (Bottom left) Colour composite image of the GOODS-north field at 24 μm (blue), 100 μm (green) and 160 μm (red). (Bottom right) Colour composite image of the GOODS-south field at 24 μm (blue), 100 μm (green) and 160 μm (red). The 24 μm images (PI: M. Dickinson) were obtained by the Spitzer Space Telescope, while the 100 and 160 μm images were obtained by the Herschel Space Observatory. In the colour composite images, sources with contribution from the 24 + 100 μm, 24 + 160 μm, 100 + 160 μm and 24 + 100 + 160 μm bands would correspond to a cyan, magenta, yellow and white colours, respectively. The relatively noisy edges of the colour composite images have been trimmed.
Current usage metrics show cumulative count of Article Views (full-text article views including HTML views, PDF and ePub downloads, according to the available data) and Abstracts Views on Vision4Press platform.
Data correspond to usage on the plateform after 2015. The current usage metrics is available 48-96 hours after online publication and is updated daily on week days.
Initial download of the metrics may take a while.