Free Access
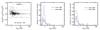
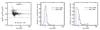
Fig. A.1
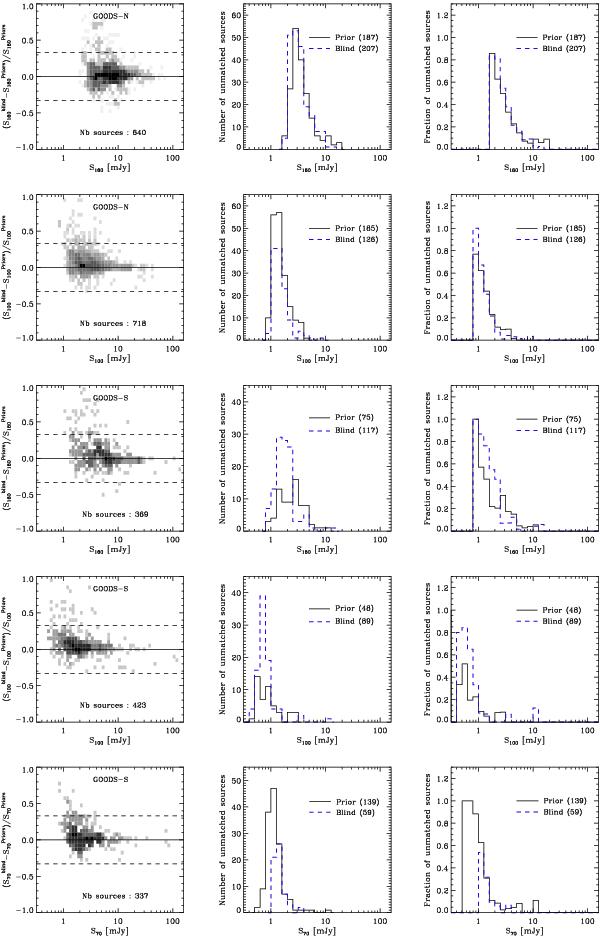
Comparison between blind and prior source catalogues. (Left panel) Direct comparison of flux densities for sources in common to both catalogues. (Centre panel) Distribution of unmatched sources in absolute number. (Right panel) Distribution of unmatched sources in fraction relative to total in the given flux density bin.
This figure is made of several images, please see below:
Current usage metrics show cumulative count of Article Views (full-text article views including HTML views, PDF and ePub downloads, according to the available data) and Abstracts Views on Vision4Press platform.
Data correspond to usage on the plateform after 2015. The current usage metrics is available 48-96 hours after online publication and is updated daily on week days.
Initial download of the metrics may take a while.