Fig. 12
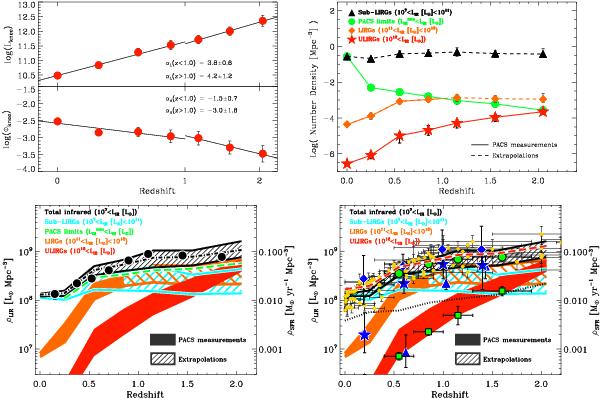
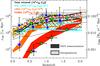
(Top left panel) Evolution of φknee and Lknee as a function of redshift. (Top right panel) Evolution of the comoving number density of “faint” galaxies (i.e., 107 L⊙ < LIR < 1011 L⊙; black triangles), LIRGs (1011 L⊙ < LIR < 1012 L⊙; orange diamonds) and ULIRGs (LIR > 1012 L⊙; red stars). Green circles show the number density of galaxies which are above the PACS detection limit of our ultradeep sub-sample (i.e., > , defined in Fig. 9). The local reference is taken from Sanders et al. (2003). (Bottom left panel) Evolution of the total comoving IR energy density (black area) and the relative contribution of the “faint” galaxies (light blue area), LIRGs (orange area) and ULIRGs (red area). The black dot-dashed line shows the best fit of the total comoving IR energy density, i.e., defined by integrating the IR LFs best-fitting our data points (see dashed lines in Fig. 10). The green dashed line shows the best fit of the comoving IR energy density of galaxies which are above the PACS detection limit of our ultradeep sub-sample (i.e., >
 ). Black circles represent the total comoving IR energy density inferred by Gruppioni et al. (2013). The right axis of the panel shows the evolution of the obscured SFR density assuming that SFR [M⊙ yr-1] = 10-10 × LIR [L⊙] for a Chabrier (2003) IMF. (Bottom right panel) Evolution of the comoving IR energy density. Areas are the same as in the bottom left panel. The dotted lines represents the unobscured SFR density of the Universe (i.e., not corrected for extinction; Cucciati et al. 2012). The red dashed line on a white background shows the total SFR density of the Universe, defined as the sum of the obscured and unobscured SFR densities. Yellow diamonds are a compilation of SFR density estimates from Hopkins & Beacom (2006). Green circles and squares are the total SFR density of the Universe and the contribution of ULIRGs estimated by Murphy et al. (2011) using deep MIPS-24 and -70 μm observations. Dark blue diamonds, stars and triangles are estimates from Casey et al. (2012) for all galaxies, LIRGs and ULIRGs, respectively, using SPIRE (i.e., submillimetre) observations. One has to keep in mind that even with our ultradeep PACS data we only constrain the IR LFs of galaxies down to LIR = 1011 L⊙ at z ~ 1 and LIR = 1012 L⊙ at z ~ 2, respectively. Therefore, number densities and IR LDs of galaxies below these limits rely upon extrapolations based on φknee and Lknee and a faint-end slope fixed at its z ~ 0 value. The redshift and luminosity ranges for which the inferred number densities and IR LDs rely upon these extrapolations are highlighted by dashed lines and striped regions, respectively. We note that these extrapolations are nevertheless corroborated by direct constraints based on deep MIPS-24 μm observations (see Fig. 11).
Current usage metrics show cumulative count of Article Views (full-text article views including HTML views, PDF and ePub downloads, according to the available data) and Abstracts Views on Vision4Press platform.
Data correspond to usage on the plateform after 2015. The current usage metrics is available 48-96 hours after online publication and is updated daily on week days.
Initial download of the metrics may take a while.