Fig. 10
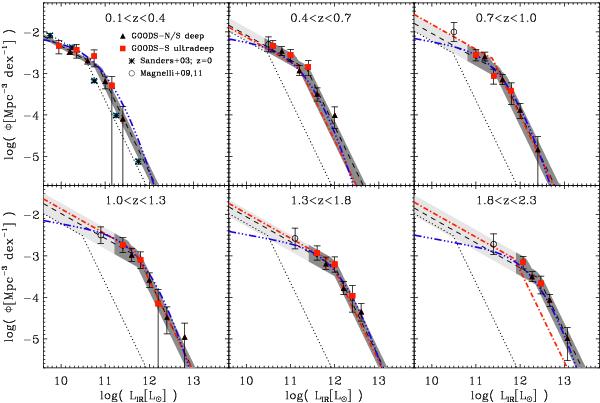
Infrared luminosity functions estimated in six redshift bins with the 1/Vmax method. Red squares and black triangles show results from our ultradeep (i.e., GOODS-S-ultradeep) and deep (i.e., GOODS-S-deep and GOODS-N) samples, respectively. Dashed lines represent the best fits to these data points with a double power-law function with fixed slopes. The shaded areas span all the solutions of these fits which are compatible, within 1σ, with our data points: the dark shaded parts of these areas highlight the luminosity ranges directly constrained by our PACS observations, while the light shaded parts highlight the luminosity ranges where our constraints rely upon extrapolations based on φknee and Lknee and a faint-end slope fixed at its z ~ 0 value. Asterisks show the local reference, taken from Sanders et al. (2003), and the dotted line is the best fitted to these data points with our double power-law function with fixed slopes. Red dot-dashed lines are results from Magnelli et al. (2009, 2011) using deep MIPS-24 μm observations. Magnelli et al. (2009, 2011) used the same double power-law function that is used here. To illustrate the infrared luminosity range constrained by Magnelli et al. (2009, 2011), we show, as open circles, their lowest infrared luminosity bins. Blue triple-dot-dashed lines present results from Gruppioni et al. (2013) who used a different analytical function to fit their data points, in particular, a much shallower faint-end slope.
Current usage metrics show cumulative count of Article Views (full-text article views including HTML views, PDF and ePub downloads, according to the available data) and Abstracts Views on Vision4Press platform.
Data correspond to usage on the plateform after 2015. The current usage metrics is available 48-96 hours after online publication and is updated daily on week days.
Initial download of the metrics may take a while.