Free Access
Fig. 1
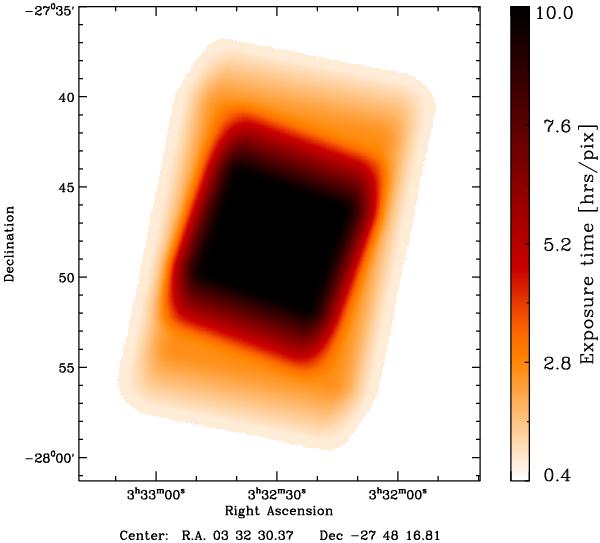
PACS-100 μm coverage map of the GOODS-S field. Due to the different layout of the PEP and GOODS-H observations, the 10′ × 10′ region centred on the GOODS-S field has much deeper PACS-100 μm observations than the outskirts. We observe the same pattern in the PACS-160 μm coverage map of the GOODS-S field.
Current usage metrics show cumulative count of Article Views (full-text article views including HTML views, PDF and ePub downloads, according to the available data) and Abstracts Views on Vision4Press platform.
Data correspond to usage on the plateform after 2015. The current usage metrics is available 48-96 hours after online publication and is updated daily on week days.
Initial download of the metrics may take a while.