Fig. 4

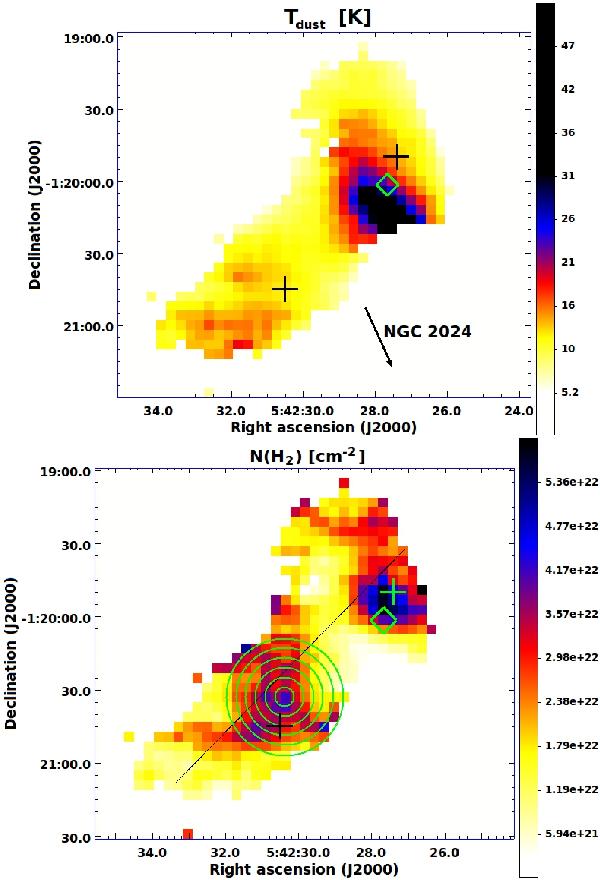
Distributions of dust colour temperature (left) and H2 column density (right). The dust emissivity index, β, was fixed at 1.8. The colour-scale bars on the right indicate the units in K and cm-2, respectively. The plus signs show the target positions of our previous molecular-line observations. The diamond symbol indicates the 24-μm emission peak of I05399. The direction towards NGC 2024 is indicated by an arrow in the left panel. The annuli used to compute the density profile shown in Fig. 6 are shown by the green circles, while the black solid line in the right panel shows the location of the slice used to extract the central column density discussed in Sect. 4.5. The resolution of the images is  or about 0.043 pc.
Current usage metrics show cumulative count of Article Views (full-text article views including HTML views, PDF and ePub downloads, according to the available data) and Abstracts Views on Vision4Press platform.
Data correspond to usage on the plateform after 2015. The current usage metrics is available 48-96 hours after online publication and is updated daily on week days.
Initial download of the metrics may take a while.


