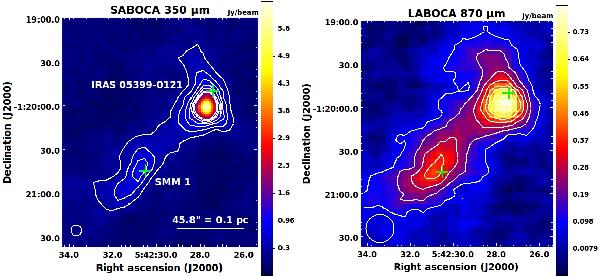
Fig. 1

SABOCA 350-μm and LABOCA 870-μm images of the I05399/SMM 1-system. The images are shown with linear scaling, and the colour bars indicate the surface-brightness scale in Jy beam-1. The overlaid SABOCA contours start at three times the noise level (3σ = 240 mJy beam-1) and increase at this interval to 1680 mJy beam-1. The LABOCA contour levels range from 90 mJy beam-1 (3σ) to 720 mJy beam-1, increasing in steps of 3σ. The green plus signs show the target positions of our previous molecular-line observations. A scale bar indicating the 0.1 pc projected length is shown in the left panel, with the assumption of a 450 pc line-of-sight distance. The effective beam sizes ( for SABOCA,
  for LABOCA) are shown in the lower left corner of the panels.
Current usage metrics show cumulative count of Article Views (full-text article views including HTML views, PDF and ePub downloads, according to the available data) and Abstracts Views on Vision4Press platform.
Data correspond to usage on the plateform after 2015. The current usage metrics is available 48-96 hours after online publication and is updated daily on week days.
Initial download of the metrics may take a while.


